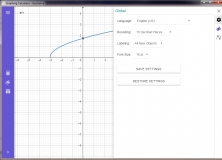
“Graph” is a powerful and feature-rich application that offers a convenient and effective solution to draw mathematical graphs in a coordinate system. Besides being comprehensive, it is provided for free and, as it's also licensed as open source, its source code can be downloaded and modified.
“Graph” offers a wide variety of customization options and manipulation possibilities for the created graphs. The colors, sizes, or line styles of the graphs can be tweaked to your liking. It can plot standard functions, parametric functions and polar functions, while the most common functions like sin, cos, log, etc. are provided as built-in, by default. This powerful tool can also display graphs for equations and inequalities and allows adding shadings, point series, and trendlines to the graphs according to your preferences. Anyway, these are just a few of the many features and tools that this comprehensive program offers.
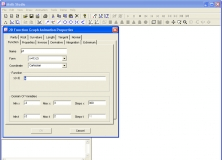
Creating your own custom constants and functions is also possible, as well as adding optional text labels to any graph. Even creating animations that show the exact changes that a function is encountering when a constant is tweaked, is possible.
I personally like a lot about this tool the fact that it can save the graphs to various image file formats, like BMP, PNG, JPEG, WMF, EMF, or even to SVG and PDF. It can also export the complete graph, with its coordinate system, into other programs, like MS Word. more
Visualize abstract mathematical concepts by generating graphs from equations.

Get the solution to almost any mathematical expression, fast, easy, and for free


Comments (7)